ProfilePerfetto.jl
Profile your Julia code and view the results in a beautiful, interactive flame chart. 🔥
ProfilePerfetto.jl is an easy-to-use profiling package for Julia, using the built-in Profile standard library and the Perfetto trace viewer — the same tool used for analyzing Chrome and Android performance traces.
By default, ProfilePerfetto will also find the right sampling rate automatically, by running your code multiple times and calibrating itself.
What is profiling?
If you want to make your code faster, you need to know exactly which parts are slow (so that you can work on the most impactful ones). With profiling, you run a piece of code while the Julia profiler samples the stack many times per second, recording what function is currently running at each sample.
Julia has a built-in statistical profiler in the Profile stdlib. This package uses the built-in profiler to collect samples, then displays them in the Perfetto UI.
A 30-second example
using ProfilePerfetto
function slow_thing()
x = 0.0
for i in 1:10_000_000
x += sin(i) * cos(i)
end
return x
end
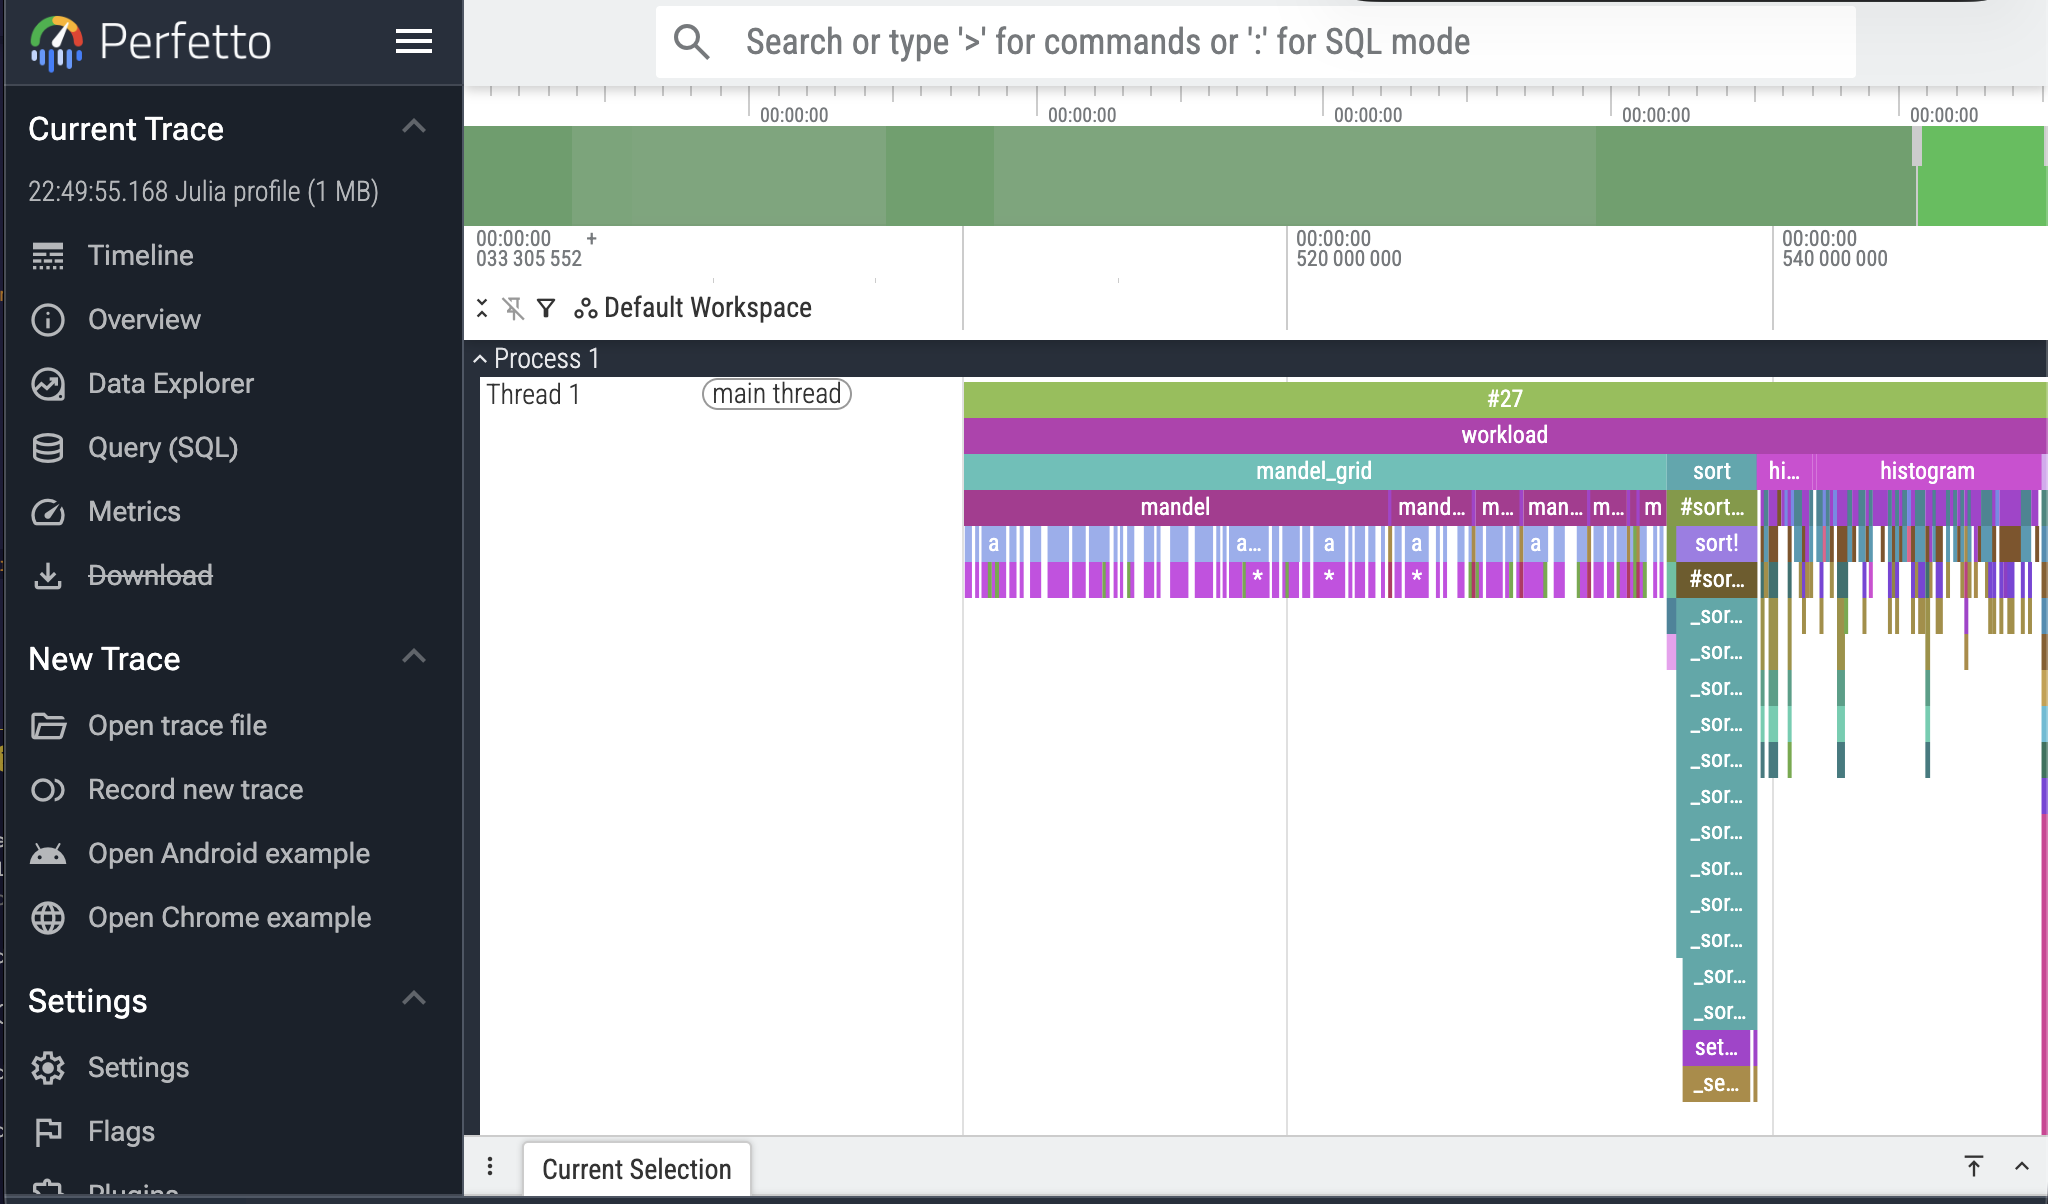
@perfetto slow_thing()Run that cell in Pluto, VS Code, or Jupyter, and you'll see an interactive flame chart appear right below it. Drag to pan, scroll to zoom, click on a bar to see the file and line number.
From the plain Julia REPL, use @perfetto_open instead — it opens the chart in your default browser.
@perfetto automatically calibrates the sampling rate for you — there's no delay knob to tune. The trade-off: it runs your code a few times to do so.
@perfetto evaluates the expression several times while calibrating. If it has observable side effects (mutating state, I/O, network calls), wrap the workload in something idempotent first, or hand pre-collected profile data to perfetto_view.
What's next?
- Getting started — a friendly walk-through for anyone new to profiling.
- Tuning the profiler — calibration knobs and how to feed in your own profile data.
- API reference — every exported name, spelled out.